Setvis Documentation Index
Setvis is a python package for exploring and visualizing data missingness (that is, the presence, number and pattern of missing data in a dataset).
It can also be used to visualize set membership of which data missingness is a special case.
The plotting and interactive workflow of Setvis (see Plotting and interactivity) is designed for use within a Jupyter notebook (although it is possible to run outside Jupyter, see Plotting outside of a notebook). The other components of Setvis can be used interactively or programmatically.
At the moment, setvis can load data from pandas dataframes, csv files, and also supports a Postgres database backend. It is designed with large datasets in mind – setvis may be able to load the missingness information from a dataset even if the dataset itself does not fit in memory.
Contents
Introductory Example
A quick example showing the output of setvis when run in a notebook.
See the tutorials and example notebooks for further examples, and an explanation of the plots and user interface.
The output is an interactive widget in the notebook (the user has
chosen the ‘combination heatmap’ view - see
setvis.plots.IntersectionHeatmap()). The selected data can be
refined by choosing elements of interest on the plot.
import pandas as pd
from setvis.plots import PlotSession

df = pd.read_csv("Synthetic_APC_DIAG_Fields.csv")

session = PlotSession(df)

session.add_plot(name="initial plot")
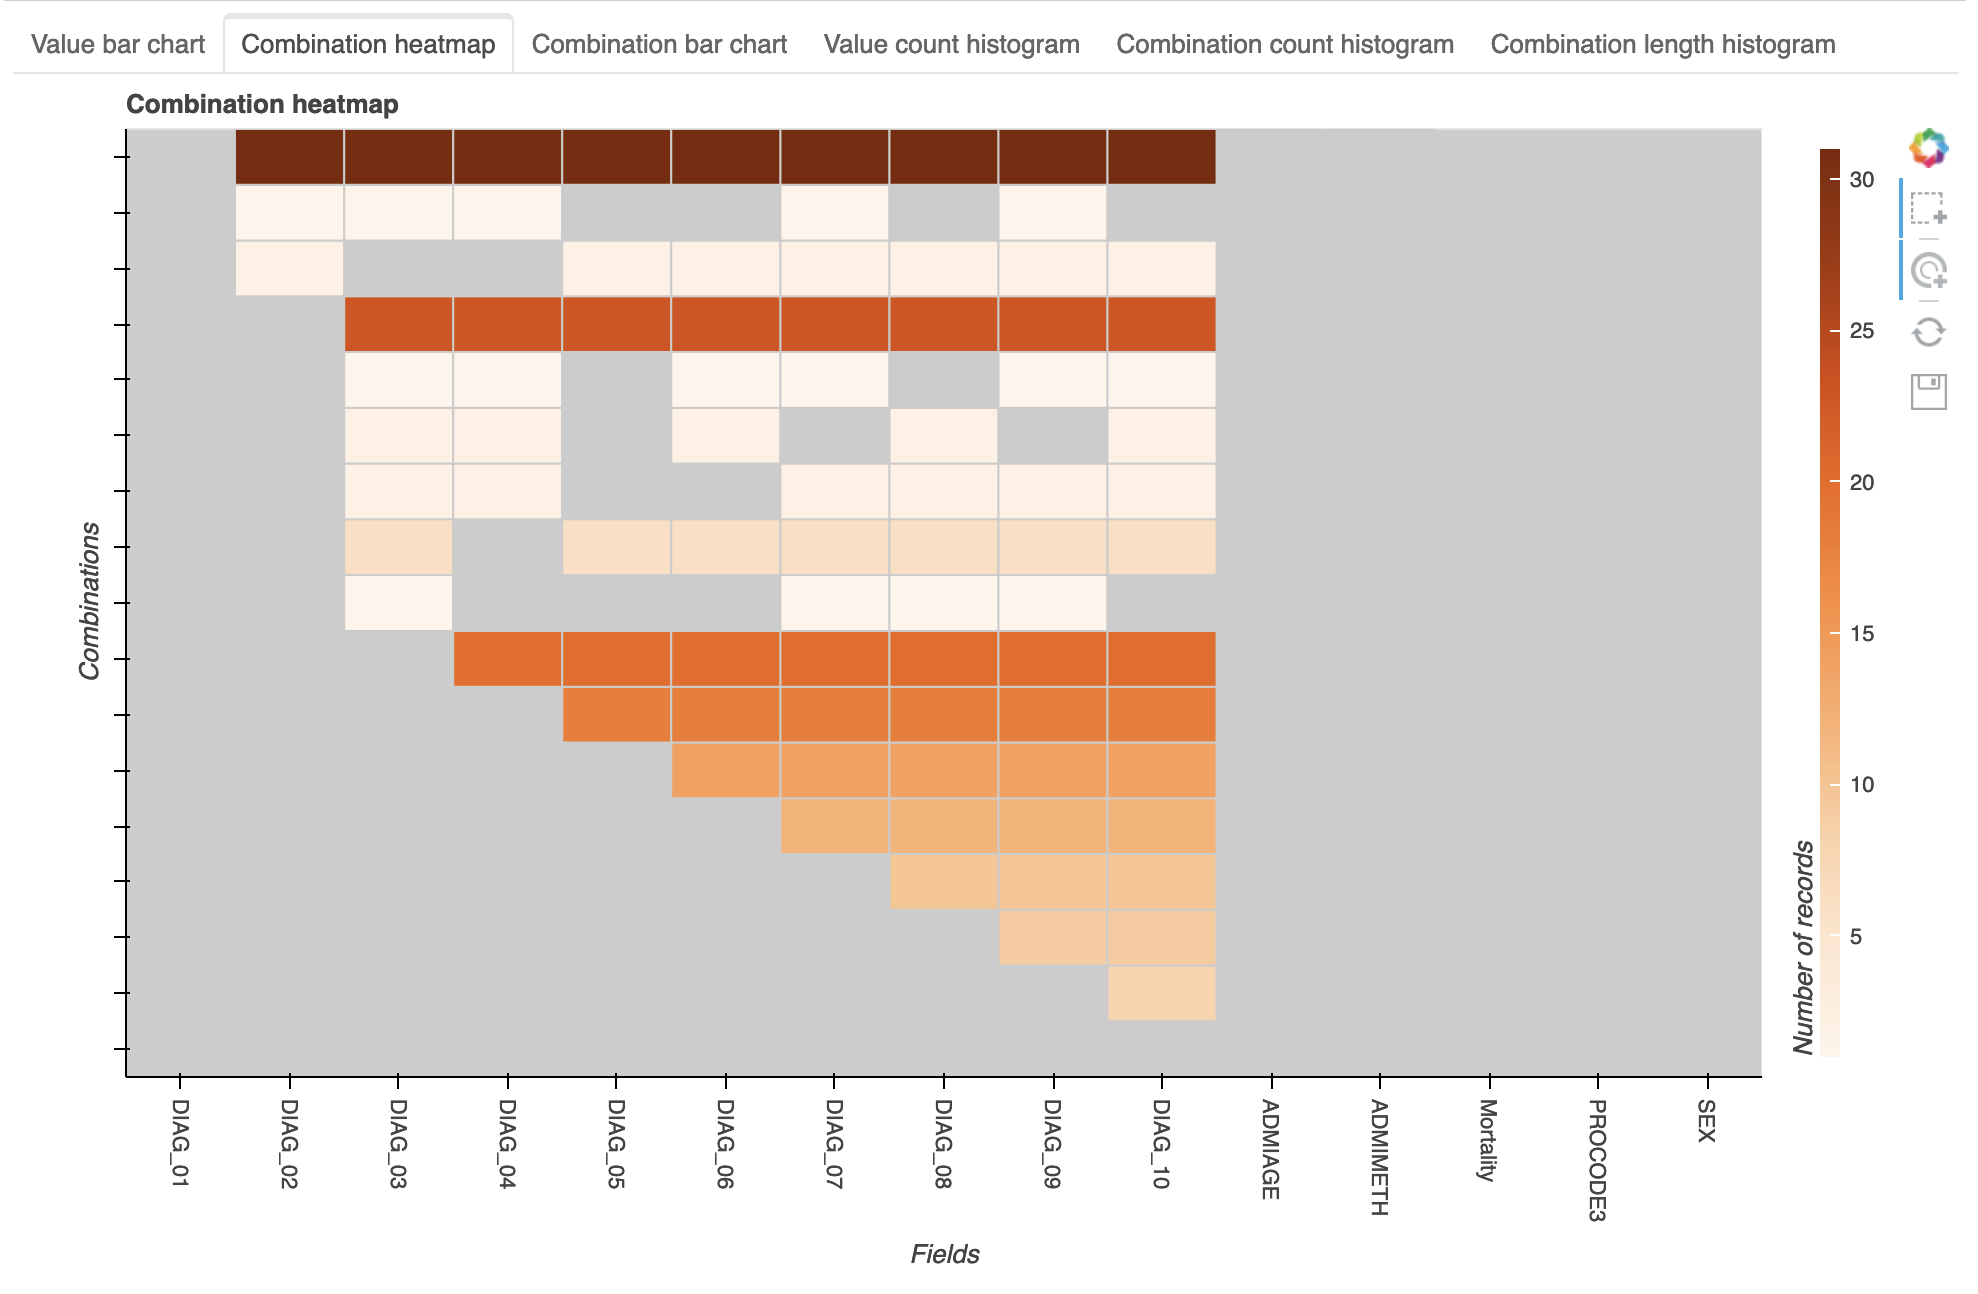
The combination heatmap shows the dataset’s fields (X axis), each combination of missing values (Y axis) and the number of records that are in each combination (colour). The most common combination is records that are missing nine fields (DIAG_02 - DIAG_10). The other six fields are never missing (DIAG_01, ADMIAGE, ADMIMETH, Mortality, PROCODE3, SEX).
Acknowledgements
The development of the setvis software was supported by funding from the Engineering and Physical Sciences Research Council (EP/N013980/1; EP/K503836/1) and the Alan Turing Institute.